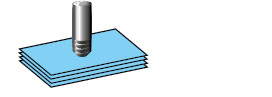
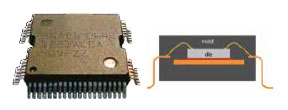
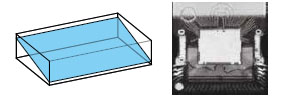
SAM is a non-destructive technique used to investigate samples like the integrated circuit represented above. For a more complete understanding of acoustic interactions and analytical convenience different scan modes are provided by PVA TePla Analytical Systems. These are explained here using the example of the integrated circuit.
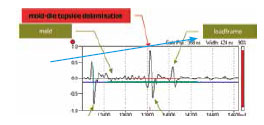
A digital waveform on the user interface displays the echoed acoustic signal. This time of flight information corresponds to the depth of the signal coming from the sample. Delaminations or voids cause total reflection and a phase shift in the acoustic wave. The A-scan is used to set one or multiple time gates to select the depth range of view (red line).
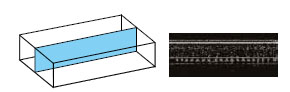
The scanner is moved in a desired direction to get a cross section image in either X or Y direction. The depth of different structures within the sample can be measured.
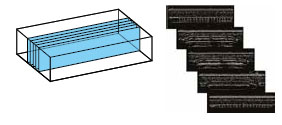
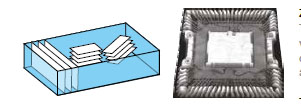
Multiple parallel cross sections (B-Scans) are recorded through the sample. The slices are free selectable.
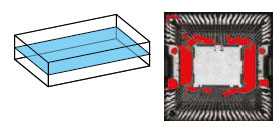
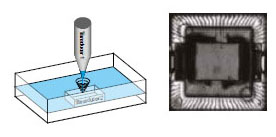
The scanner is moved in a meander pattern over the sample. The resulting image, composed line by line, represents a cross section in the x, y axis (parallel to the surface). Delaminated areas can be highlighted automatically and are shown here in red.
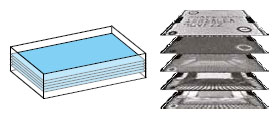
More than 50 C-Scan images can be displayed from different layers during a single scan in real time. Each image represents the same layer depth. Areas and image depths are freely selectable by the operator.
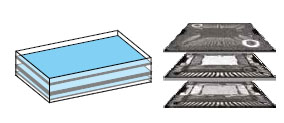
The G-scan produces multiple C-scan images at defined layer depths and thicknesses. Different settings can be stored for automatic evaluation. If more than one gate is placed (G-Scan), multiple images are acquired simultaneously and displayed on the monitor.
D-scan combines the B-Scan and C-Scan functions to a meander scan. The resulting image represents a diagonal section through the sample.
The Z-Scan simulates 3-D imaging of the substrate volume. The Z-Scan enables offline reconstruction of A, B, C, D, P, X, 3-D Scans and time of flight images with free selectable gate windows.
A transducer above the samples emits an ultrasonic signal which will be detected by a second transducer placed underneath the sample. In this mode images are collected containing shadows of defects causing strong acoustic reflections. Both transducers can simultaneously probe the sample giving both Through-Scan and C- Scan images.
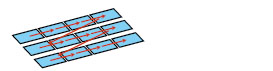
The T-Scan or tray scan enables automatic evaluation of a series of equispaced and identical specimens in succession. A specimen tray or holder is typically needed.
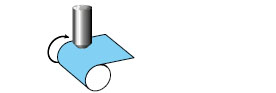
A cylindrical sample is inspected by rotating it around its centre axis.
V(z)-Scans measure acoustic reflection intensities as a function of the lens position in the z-axis. Intensities graphed versus z-axis position result in V(z) curve plots. From these plots the physical properties of materials can be calculated.